ScienceSource.ca Technology Lab Activity | Unit A - Chapter 1 |
Investigating Science 9 | Inquiry Activity |
Rate of Photosynthesis
Skills Reference 2
Skills you Will Use
- Using appropriate equipment and tools
- Adapting or extending procedures
Safety
Caution
Use caution when working around the light bulb, as it will be very hot when turned on. Protect your hands with gloves when necessary.
Be careful when using sharp objects.
The process of photosynthesis is the chemical pathway by which plants make food from carbon dioxide, water, and sunlight.
carbon dioxide + water + sunlight → glucose + oxygen
When a plant is exposed to light, it undergoes photosynthesis and aerobic cellular respiration at the same time. When the plant is not exposed to light, it undergoes cellular respiration (and uses oxygen), but it does not undergo photosynthesis.
In this activity, you will use a sensor to measure the change in pressure in a test tube that contains an aquatic plant. You will expose the test tube and plant to white light, green light, and to no light.
Question
How does the rate of photosynthesis change when a plant is exposed to different light conditions?
Materials and Equipment
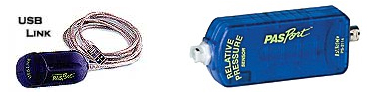
- relative or low-pressure sensor with tubing and quick release connectors
- USB link, computer, data recording software
- glycerin
- bowl
- tap water
- elodea plant
- sharp knife
- test tube and one-hole rubber stopper to fit tube
- 3% sodium bicarbonate solution
- test tube clamp, base, and support rod
- 1000 mL beaker
- 100 watt lamp
- 10 cm x 10 cm sheet aluminum foil
- green food colouring
Procedure
- Connect your pressure sensor to your computer with an interface, such as a USB link.
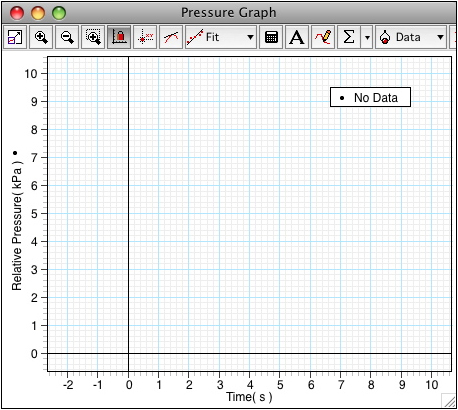
- When you connect the sensor to the link, the computer will likely display a pressure versus time graph. If it does not, configure your data collection software to display a graph like the one below.
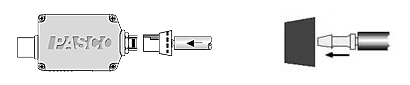
- Place the barbed end of a quick-release connector into one end of the plastic tubing. Use a drop of glycerin for lubrication if needed. Connect the other end of the connector to the pressure sensor. With the help of a few more drops of glycerin, put a narrow connector into the other end of the plastic tubing. Then push the narrow connector into the top of the rubber stopper as shown below.
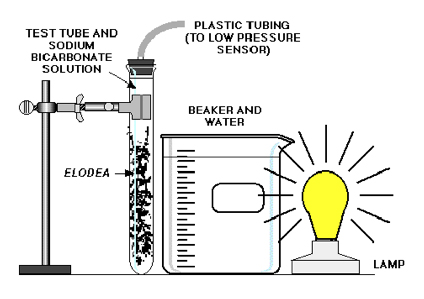
- Fill a bowl with water. Hold a generous quantity of elodea under the water and use the knife to cut the stems. Place the elodea with the cut ends up into a test tube. Fill the test tube to about 2 cm below the top with 3% sodium bicarbonate solution.
- Use the test tube clamp to mount the test tube on the base and support rod. Put the rubber stopper into the top of the test tube. Fill the beaker with plain water and place the beaker next to the test tube. The water in the beaker acts as a heat absorber. Place the lamp next to the beaker as shown below.
- Test 1 - White Light
Turn on the lamp. Click the start button in the data collection software to begin collecting data. Allow data to collect for 10 minutes. Turn off the lamp. Carefully disconnect the tubing from the pressure sensor to release the pressure in the tubing. Then re-connect the tubing.
- Test 2 - No Light
Cover the test tube with the aluminum foil. Repeat step 6.
- Test 3 - Green Treatment with White Light
Remove the aluminum foil. Add a few drops of green food colouring to the water in the beaker, enough to give it a medium green colour. Repeat step 6.
- Test 4 - Green Treatment with No Light
Cover the test tube with the aluminum foil, then repeat step 6.
Analyzing and Interpreting
- Use the graph display to determine the minimum and maximum pressure for each of the four tests. In some software, this can be made easier by clicking the statistics menu button.
- Record all of the following in a suitable data table, such as the one provided at the end of this document.
- Calculate the difference between the minimum and maximum pressure for all four tests. Record this difference as net change in your data table.
- Calculate and record the gross change for Tests 1 and 2 (white light) by adding the two net changes together. Do the same for Tests 3 and 4.
- Calculate and record the rate of photosynthesis by multiplying the gross changes by 6. This calculation will result in the pressure change per hour (kPa/h).
- How does the rate of photosynthesis compare when the plant is exposed to green light as opposed to when the plant is exposed to white light, or no light?
- Why did the pressure not increase in the tube under no-light conditions?
Skill Practice
- Design a lab that investigates whether red and blue light promote photosynthesis.
Forming Conclusions
- How does the rate of photosynthesis change when a plant is exposed to different light conditions?
Please note that this activity may require proprietary software and/or hardware. Pearson Education provides this activity material for your convenience, but in doing so does not constitute an endorsement of any particular 3rd party software or hardware. Pearson Education cannot provide customer support for 3rd party software or hardware.
For more suggestions and information on obtaining proprietary software and/or hardware technologies that may be suitable for this activity, please see the website FAQ - Help page.