ScienceSource Supplemental Lab Activity | Unit C - Chapter 8 |
Investigating Science 10 | Inquiry Activity |
Analyzing Carbon Dioxide Measurements
Skills Reference 2
Skills you Will Use
- Interpreting data/information to identify patterns or relationships
- Using numeric, symbolic, and graphic modes of representation
Carbon dioxide is a gas that is important for a variety of reasons. Along with its role in the lives of plants and animals, it is also very important to the Earth's temperature. The amount of carbon dioxide in Earth's atmosphere is thought to be very closely linked to the average temperature of our planet.
Question
What does monitoring information indicate about trends in amounts of atmospheric carbon dioxide?
Materials and Equipment
- graph paper (or graphing software)
- coloured pencils or pens
Procedure
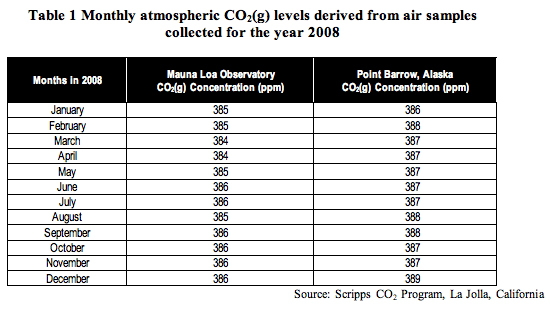
- On a single graph, plot two line graphs from the data in Table 1 at the top of the next page. (Refer to Skills Reference 9 at the back of your student book for more information on drawing graphs.) On your graph, use one line to show the data from Hawaii, and the other to show the data from Alaska. Use a different colour or symbol for each set of data. These graphs represent monthly CO2(g) concentrations for the year 2008.
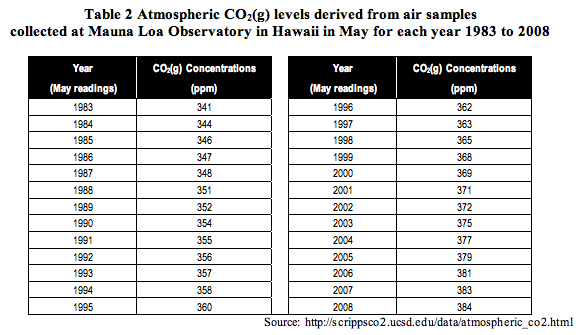
- Use the data provided in Table 2 to prepare a different line graph of yearly CO2(g) concentrations measured each March at Mauna Loa, Hawaii.
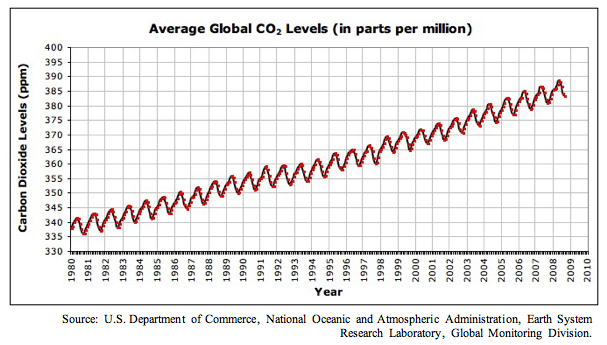
- Look at the graph below as a guide. Use a different-coloured pencil or pen to draw a line of best fit on your graph of yearly CO2(g) concentrations.
Analyzing and Interpreting
- Look at the graph you prepared with the data from Table 1. What do you notice about the amounts of atmospheric CO2(g) over one year? Why do you think this occurs?
- Is there any difference in the data from the two collecting sites? Why do you think this occurs?
- Suggest a reason why Mauna Loa, Hawaii, and Point Barrow, Alaska, would be chosen as good sites to monitor atmospheric CO2(g).
- What is the trend in the amount of atmospheric CO2(g) from 1983 to 2008, as recorded at Mauna Loa?
Skill Practice
- Why would Timmins, Ontario, be a good choice for a third location to test for atmospheric CO2(g) levels?
Forming Conclusions
- Examine your graphs as well as the graph of average global CO2 levels referenced in step 3. Explain what monitoring information indicates about monthly and yearly trends in atmospheric CO2(g) concentrations.


